California is renowned for its stunning natural landscapes, dynamic cultural scene, and abundant economic opportunities. However, not all places within the Golden State share an equal level of safety. Some cities face a more significant challenge in combating criminal activity, which distinguishes them as the most unsafe places to reside. Contrary to common assumptions, larger urban centers like Los Angeles and San Francisco don’t always exhibit the highest levels of danger. Surprisingly, smaller cities can outpace their larger counterparts in terms of crime rates. Before exploring the 10 most dangerous cities in California, draw attention to the table featuring the population and crime rate in the 100 Most Dangerous Cities in the state.
List Of 100 Most Dangerous Cities In California: Violent Crime RatePer 100,000 Residents
| Rank | City | Population | Violent Crime Rate |
| 1 | Stockton | 313,604 | 1,397 per 100k |
| 2 | San Bernardino | 216,715 | 1,318 per 100k |
| 3 | Oakland | 434,036 | 1,271 per 100k |
| 4 | Compton | 96,638 | 1,142 per 100k |
| 5 | Richmond | 110,988 | 931 per 100k |
| 6 | Lancaster | 159,335 | 853 per 100k |
| 7 | Vallejo | 122,657 | 845 per 100k |
| 8 | Modesto | 216,542 | 812 per 100k |
| 9 | Victorville | 123,089 | 803 per 100k |
| 10 | Huntington Park | 58,181 | 787 per 100k |
| 11 | Los Angeles | 4,015,546 | 732 per 100k |
| 12 | Hawthorne | 87,305 | 728 per 100k |
| 13 | Santa Monica | 91,621 | 725 per 100k |
| 14 | San Francisco | 886,007 | 670 per 100k |
| 15 | South Gate | 94,445 | 659 per 100k |
| 16 | Highland | 55,686 | 650 per 100k |
| 17 | Merced | 83,854 | 644 per 100k |
| 18 | Lynwood | 70,619 | 643 per 100k |
| 19 | Paramount | 54,422 | 638 per 100k |
| 20 | Sacramento | 513,934 | 627 per 100k |
| 21 | Pomona | 152,776 | 615 per 100k |
| 22 | Inglewood | 109,398 | 613 per 100k |
| 23 | Pittsburg | 73,637 | 606 per 100k |
| 24 | Watsonville | 54,261 | 604 per 100k |
| 25 | Santa Cruz | 65,263 | 596 per 100k |
| 26 | National City | 61,791 | 589 per 100k |
| 27 | Chico | 95,826 | 581 per 100k |
| 28 | Antioch | 112,641 | 575 per 100k |
| 29 | Turlock | 74,120 | 575 per 100k |
| 30 | Rialto | 103,965 | 572 per 100k |
| 31 | Indio | 92,803 | 571 per 100k |
| 32 | Gardena | 59,833 | 542 per 100k |
| 33 | El Cajon | 103,686 | 532 per 100k |
| 34 | Long Beach | 467,974 | 506 per 100k |
| 35 | Riverside | 333,260 | 506 per 100k |
| 36 | Madera | 66,250 | 504 per 100k |
| 37 | Berkeley | 122,788 | 503 per 100k |
| 38 | San Leandro | 90,297 | 503 per 100k |
| 39 | Salinas | 156,943 | 498 per 100k |
| 40 | Carson | 91,947 | 483 per 100k |
| 41 | Santa Rosa | 177,884 | 482 per 100k |
| 42 | Hesperia | 95,915 | 482 per 100k |
| 43 | Apple Valley | 74,051 | 458 per 100k |
| 44 | Bakersfield | 388,080 | 455 per 100k |
| 45 | Hanford | 57,232 | 449 per 100k |
| 46 | San Jose | 1,040,008 | 438 per 100k |
| 47 | Santa Barbara | 91,717 | 436 per 100k |
| 48 | Santa Ana | 333,663 | 435 per 100k |
| 49 | Visalia | 134,961 | 434 per 100k |
| 50 | Pasadena | 141,913 | 432 per 100k |
| 51 | Bellflower | 77,196 | 424 per 100k |
| 52 | Palmdale | 157,138 | 419 per 100k |
| 53 | Gilroy | 60,106 | 418 per 100k |
| 54 | Concord | 130,615 | 414 per 100k |
| 55 | Norwalk | 105,067 | 411 per 100k |
| 56 | Ventura | 111,596 | 410 per 100k |
| 57 | Oceanside | 177,129 | 402 per 100k |
| 58 | Moreno Valley | 210,979 | 401 per 100k |
| 59 | Tulare | 65,134 | 401 per 100k |
| 60 | Hemet | 86,082 | 398 per 100k |
| 61 | San Rafael | 58,819 | 391 per 100k |
| 62 | Colton | 55,059 | 390 per 100k |
| 63 | West Sacramento | 54,372 | 390 per 100k |
| 64 | Delano | 53,002 | 387 per 100k |
| 65 | Upland | 77,398 | 385 per 100k |
| 66 | Fairfield | 118,383 | 373 per 100k |
| 67 | Pico Rivera | 62,880 | 372 per 100k |
| 68 | Placentia | 51,756 | 371 per 100k |
| 69 | Yucaipa | 53,964 | 371 per 100k |
| 70 | Union City | 75,202 | 368 per 100k |
| 71 | Woodland | 61,176 | 366 per 100k |
| 72 | San Diego | 1,441,737 | 362 per 100k |
| 73 | Ontario | 183,322 | 359 per 100k |
| 74 | Yuba City | 67,164 | 359 per 100k |
| 75 | Redlands | 71,941 | 357 per 100k |
| 76 | Citrus Heights | 88,496 | 354 per 100k |
| 77 | Chino | 93,348 | 352 per 100k |
| 78 | Napa | 79,526 | 352 per 100k |
| 79 | Lodi | 67,612 | 351 per 100k |
| 80 | Escondido | 153,215 | 350 per 100k |
| 81 | Vista | 102,227 | 346 per 100k |
| 82 | Oxnard | 211,349 | 343 per 100k |
| 83 | Fontana | 215,883 | 342 per 100k |
| 84 | Hayward | 161,588 | 342 per 100k |
| 85 | Chula Vista | 275,230 | 328 per 100k |
| 86 | Vacaville | 101,147 | 327 per 100k |
| 87 | Perris | 80,500 | 325 per 100k |
| 88 | Rosemead | 54,489 | 321 per 100k |
| 89 | Porterville | 60,209 | 319 per 100k |
| 90 | Anaheim | 353,915 | 316 per 100k |
| 91 | Downey | 112,330 | 313 per 100k |
| 92 | Petaluma | 62,425 | 304 per 100k |
| 93 | Buena Park | 82,627 | 298 per 100k |
| 94 | Glendora | 52,211 | 297 per 100k |
| 95 | Rancho Cordova | 75,869 | 297 per 100k |
| 96 | Garden Grove | 172,832 | 292 per 100k |
| 97 | La Mesa | 59,865 | 291 per 100k |
| 98 | Jurupa Valley | 110,111 | 288 per 100k |
| 99 | Azusa | 50,405 | 286 per 100k |
| 100 | Westminster | 91,086 | 284 per 100k |
Source:spolinlaw.com website
10 Most Dangerous Cities in California
From Stockton, with its staggering reported violent crimes, to Huntington Park, where incidents persist on a smaller scale, each of these cities faces unique safety challenges that deserve attention and consideration. Let’s explore“California’s most dangerous cities, delving into aspects such as population, violent crime rates, types of crimes, and more.
1. Stockton

Taking the top spot as the most unsafe city in California, Stockton, with a population of 313,604, experiences a staggering 4,380 reported violent crimes. This results in a violent crime rate of 1,397 incidents per 100,000 residents. The city witnesses approximately 34 homicides, 181 sexual assaults, 1,158 robberies, and 3,007 aggravated assaults on an annual basis.
2. San Bernardino
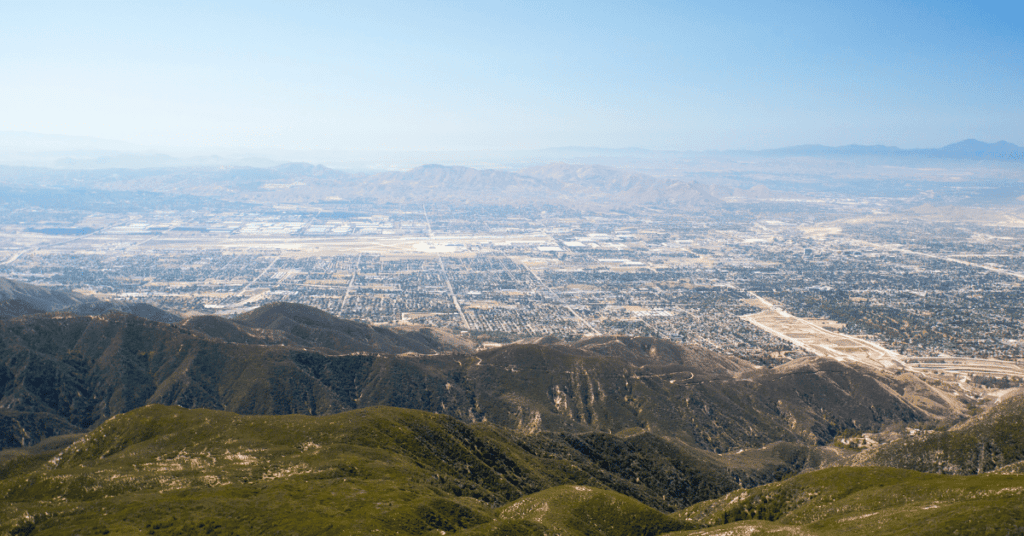
San Bernardino, home to 216,715 individuals, secures the second position on the list. The city reports 2,858 violent crimes, yielding a violent crime rate of 1,318 incidents per 100,000 people. Notable statistics encompass around 46 murders, 140 rapes, 906 robberies, and 1,766 aggravated assaults each year.
3. Oakland
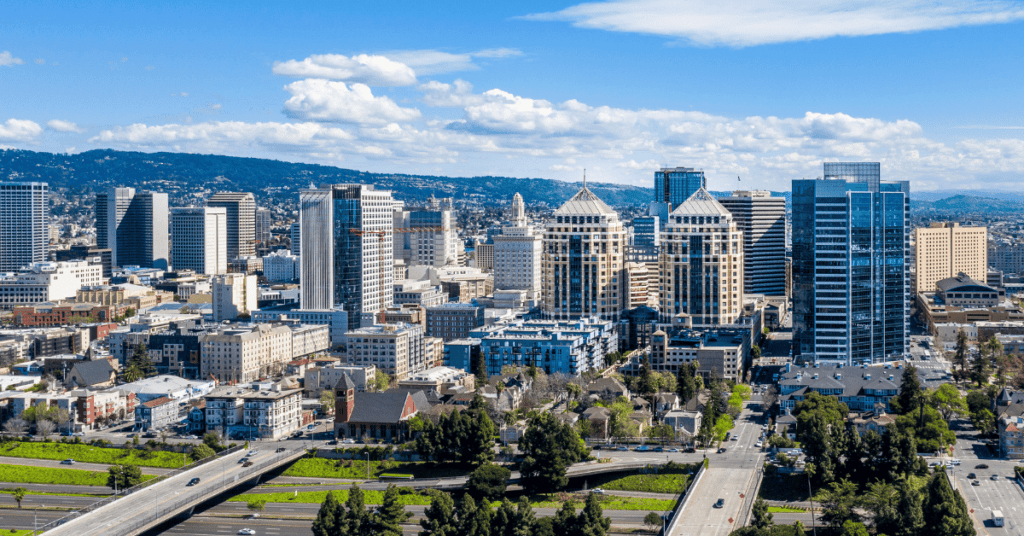
Oakland, housing 434,036 residents, claims the third spot. With 5,520 reported violent crimes, the city exhibits a violent crime rate of 1,271 incidents per 100,000 residents. Prominent figures include approximately 78 homicides, 372 sexual assaults, 2,859 robberies, and 2,211 aggravated assaults annually.
You might find my articles on these topics interesting to read:
10 Most Dangerous Cities in the World 2023
Top 10 Most Dangerous Cities in the US
4. Compton
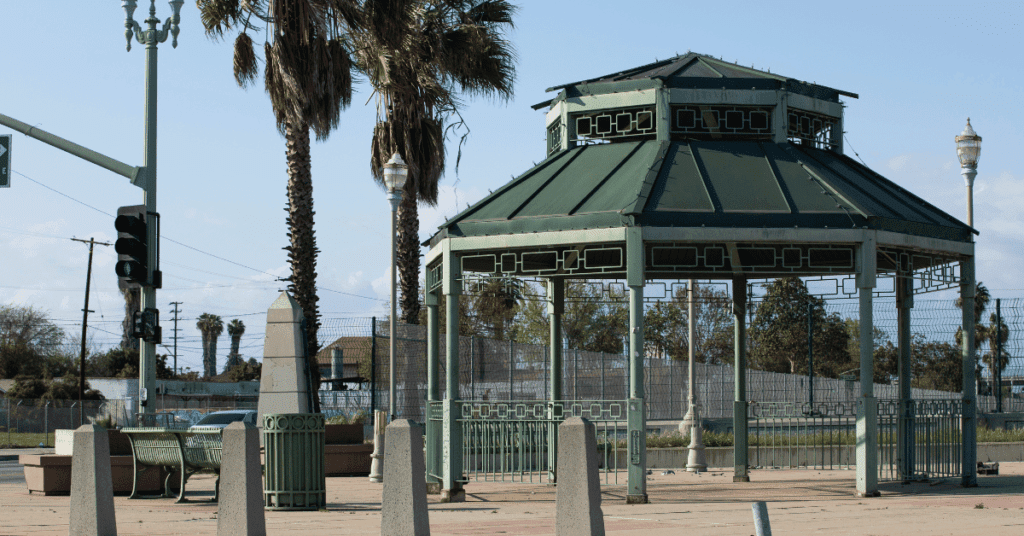
Compton, with a population of 96,638, takes fourth place. The city reports 1,104 violent crimes, resulting in a violent crime rate of 1,142 incidents per 100,000 individuals. Notable data involves approximately 18 homicides, 40 sexual assaults, 427 robberies, and 619 aggravated assaults each year.
5. Richmond
With a population of 110,988, Richmond secures the fifth ranking. The city experiences 1,034 reported violent crimes, leading to a violent crime rate of 931 incidents per 100,000 residents. Noteworthy statistics include around 16 homicides, 36 sexual assaults, 307 robberies, and 675 aggravated assaults annually.
6. Lancaster

Lancaster, accommodating 159,335 people, ranks as the sixth most dangerous city. The city records 1,359 violent crimes, culminating in a violent crime rate of 853 incidents per 100,000 residents. The city sees approximately 7 homicides, 114 sexual assaults, 374 robberies, and 864 aggravated assaults each year.
7. Vallejo
Vallejo, with a population of 122,657, claims the seventh position. The city reports 1,037 violent crimes, resulting in a violent crime rate of 845 incidents per 100,000 people. Notable figures comprise approximately 12 homicides, 138 sexual assaults, 336 robberies, and 551 aggravated assaults annually.
8. Modesto

Modesto, housing 216,542 residents, secures the eighth spot. The city registers 1,758 violent crimes, resulting in a violent crime rate of 812 incidents per 100,000 residents. Key statistics involve around 13 homicides, 94 sexual assaults, 399 robberies, and 1,252 aggravated assaults each year.
9. Victorville

Victorville, with a population of 123,089, ranks as the ninth most dangerous city. The city records 988 violent crimes, leading to a violent crime rate of 803 incidents per 100,000 individuals. Noteworthy data includes approximately 5 homicides, 45 sexual assaults, 255 robberies, and 683 aggravated assaults annually.
10. Huntington Park
Huntington Park, home to 58,181 people, occupies the tenth position. The city reports 458 violent crimes, resulting in a violent crime rate of 787 incidents per 100,000 residents. The city witnesses around 3 homicides, 31 sexual assaults, 249 robberies, and 175 aggravated assaults on an annual basis.”
Conclusion
These cities serve as a poignant reminder of the diverse challenges California faces in terms of crime prevention and public safety. From social and economic factors to law enforcement capabilities, numerous variables contribute to these cities’ crime rates. However, it is important to note that despite these crime statistics, each city holds its unique vibrancy and potential for change.


3 Comments on “Top 10 Most Dangerous Cities in California”